Stride Data Explained
There are four ways to read a race with data, and three of them read the race. Pace, speed figures and sectional times all describe what happened on the day, shaped by the tempo, the draw and the ground. Stride data is the odd one out. It reads the horse itself, its engine, and the trip it really wants. While a sectional tells you a horse finished better than its placing, stride data tells you whether that closing burst was a stayer’s long stride or a sprinter’s quick one. The man who brought it into the mainstream is Simon Rowlands, formerly Timeform’s head of research and freelance since 2016, whose At The Races “Sectional Spotlight” column did the explaining, and his starting point is as simple as it gets: a horse’s speed is its stride length multiplied by its stride frequency.
Any term on this page that’s new to you is defined in the racing glossary.
What stride data is
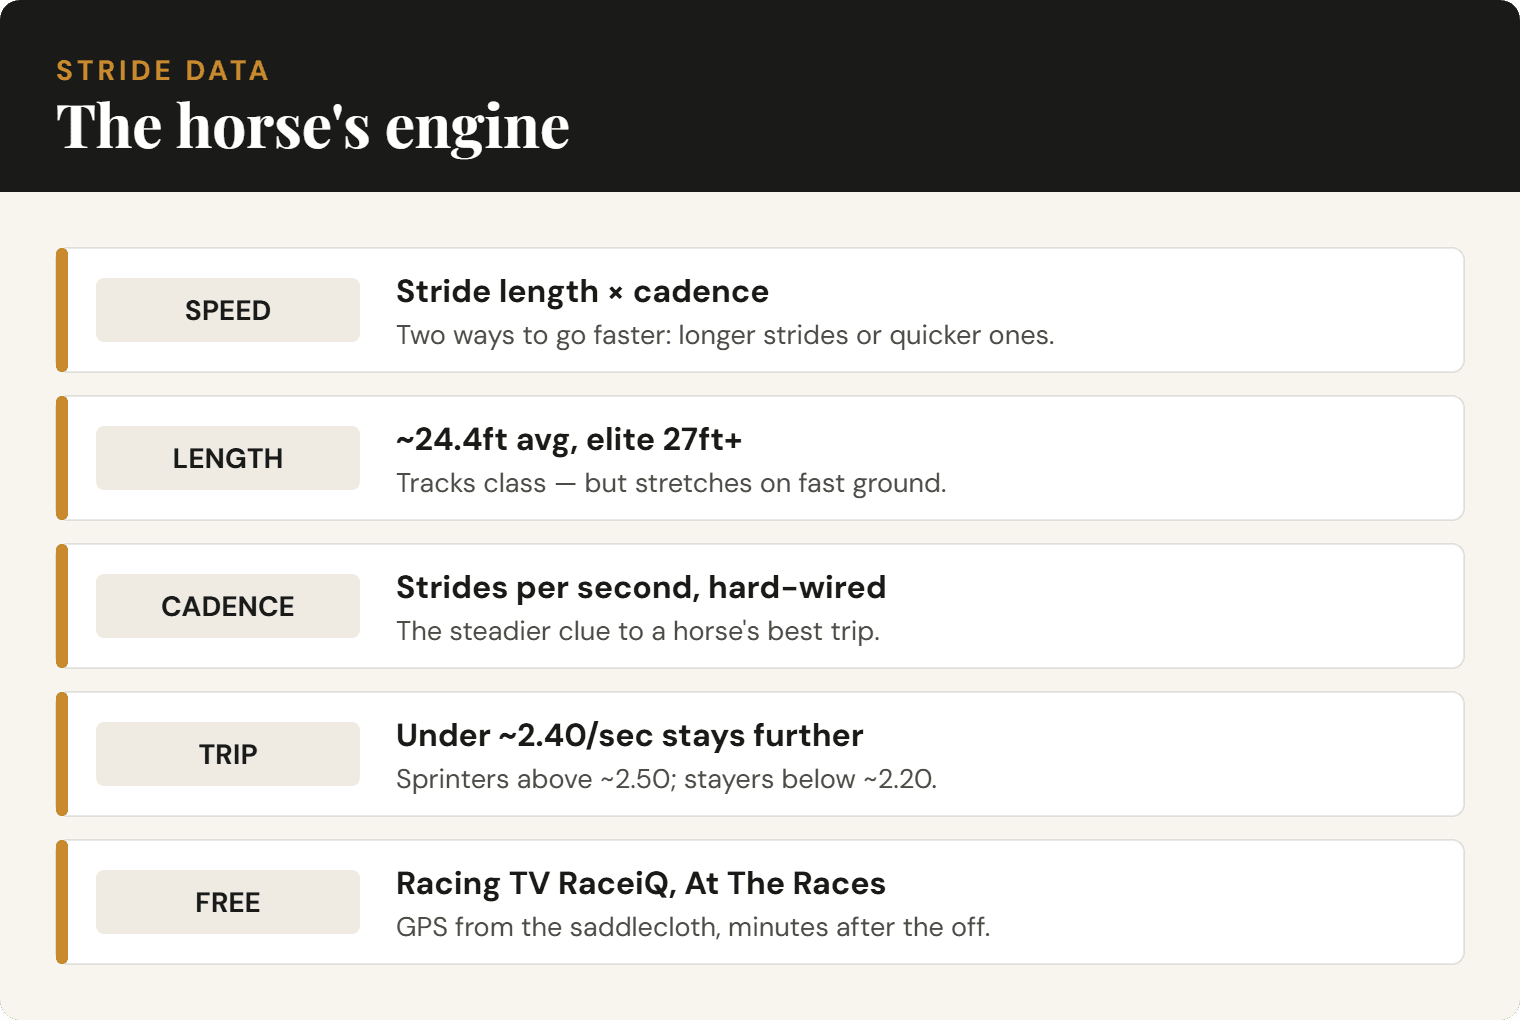
Strip the jargon and stride data is one equation. Speed = stride length × stride frequency. A horse goes faster by lengthening its stride, by quickening it, or by doing both. There is nothing else in the sum.
Stride length is the ground a horse covers with one complete stride, in feet or metres. Stride frequency, usually called cadence, is how many complete strides it turns over each second. Rowlands puts it plainly: “A horse’s speed is a product of its stride length and stride frequency: it is as simple as that.” An eight-yard stride turned over two and a half times a second is a horse covering twenty yards a second, and that is the only maths the subject demands.
The value is in splitting one number into two. Two horses can record the same speed and reach it in completely different ways, one with a long, lazy stride, the other with a short, rapid one. The clock cannot tell them apart. Stride data can, and the gap between those two engines is what decides which trip and which track each really wants.
How it is measured
In Britain the figures come from a GPS sensor carried in the saddlecloth, not from a camera in the stands. Total Performance Data, the firm founded in 2013 that first brought GPS race-tracking to British racing, fits a lightweight tracker to every runner that fixes the horse’s position on the course many times a second. From that single position trace everything else is worked out: speed, distance, running position, sectional splits and the stride figures.
That last point is the one most people miss. There is no separate stride sensor. Stride length and cadence are derived from the oscillations in the position trace, the regular rise and fall as the horse bounds along, which is what lets one saddlecloth unit produce the whole picture. At The Races averages the per-second readings over each furlong before publishing them.
It is precise but not perfect. Total Performance Data reports that 85 per cent of its tracked horses are recorded to within a metre, often within centimetres — and a metre is about 0.4 of a horse’s length, not far off half. The error is small but real, which matters once you start reading figures to the second decimal place.
What stride length tells you
Stride length is broadly a measure of class. The bigger, more powerful, more talented horse tends to cover more ground per bound, so a long stride is a marker of raw ability. The very best live at the top of the scale: Rowlands recorded Frankel at about 27.3 feet in the 2011 Sussex Stakes at Goodwood and Cracksman at about 26.1 feet in the 2017 Great Voltigeur at York — single-race peaks, not career averages — and the truly elite top 27 feet as a matter of course.
The catch is that stride length flatters and lies depending on where it was set. It stretches on fast ground and downhill, and shortens on soft ground and uphill. A horse striding 25 feet at Epsom on quick going has not necessarily got a longer stride than one recorded at 24 feet up a soft Beverley hill, it has simply had an easier surface to do it on. So a raw stride-length figure is an ability clue rather than a fixed property of the horse, and you cannot lift it from one track and lay it against another as like for like.
What cadence tells you
Cadence is the more useful of the two, because it is harder-wired. Where stride length flexes with the going, a horse’s stride frequency appears largely fixed from an early stage and stays fairly constant across its career and across conditions. That stability is what makes it a clue to the horse rather than the day. A peer-reviewed study of Thoroughbreds in actual races put the mean stride rate at about 2.34 strides a second, and found stride rate fell as race distance rose while stride length barely changed — the statistical version of the same idea: cadence carries the distance signal.
Rowlands turned that into a rough guide to optimum trip, reading the peak cadence a horse hits. Treat these as guides, not hard lines:
Cadence by trip — a rough guide
- SprintersPeak above roughly 2.50 strides a second (a threshold that moved from 2.43 in 2018 to 2.50 in 2020 as the data grew). Quick turnover, shorter trips.
- MilersAround 2.40 to 2.45.
- Middle-distDerby types roughly 2.20 to 2.35.
- StayersBelow roughly 2.20. The slowest turnover, the most stamina.
The rules of thumb
- 8f+ pointerA peak cadence under roughly 2.40 suggests a horse wants beyond a mile.
- 12f+ pointerA peak around 2.35 or less points to a mile and a half or beyond.
- Why it worksCadence varies little with going, so it survives the change of track that distorts stride length.
- The readingLower cadence implies a horse can switch off, not over-race, and suggests stamina.
The worked example is his own. Assessing High Definition, the winter favourite for the 2021 Derby, Rowlands read a peak cadence of about 2.29 strides a second and a minimum down around 2.14 to 2.16. On his bands that is not a miler. He concluded the colt showed “the figures usually associated with a Derby horse, or even a St Leger horse, and not a Guineas contender”, and the read came from cadence rather than from any line of form. That is the discipline in miniature: a number off the position trace, set against a benchmark, producing a view on trip that the racecard alone would not give you. The call itself did not cash — High Definition skipped Epsom and finished second-last of 12 as 9/4 favourite in the Irish Derby — which is the limits box below in action: hold the method, not any single read.
Reading a stride profile
A peak figure on its own is half the story. The other half is how long the horse holds it. A stride or cadence line that climbs to a peak and sustains it through the line is the signature of stamina, a horse seeing out its trip. A line that reaches a peak and then tapers away late is the signature of fatigue, often a sign the horse was racing beyond its best distance. The mark of a top-class animal is one that combines a long stride with a high cadence and then holds both for a long stretch of the race.
How a horse accelerates
The profile also shows you how a horse accelerates, and there are two ways to do it: lengthen the stride, eating more ground per bound, or quicken the cadence, turning the same stride over faster. Horses tend to reach a gallop by raising cadence first and then add stride length on top, and at the very top end it is stride length, not turnover, that sets the fastest speeds (Locomotory Profiles in Thoroughbreds, 2022) — which is why a fast, sustainable turnover is the prized asset in a sprint and an efficient long stride is the asset over a longer trip.
Why the surface changes the reading
Surface bends the whole reading. On all-weather and dirt, horses cannot spring off the ground the way they do on turf, so they tend to show a higher cadence and a shorter stride. The clearest recent case is City Of Troy before the 2024 Breeders’ Cup Classic, where analysts flagged him as a question mark on dirt precisely because he had a long stride he could not turn over fast enough for the surface; he finished eighth behind Sierra Leone. Read a dirt profile against a turf benchmark and you will misjudge it, so always note the surface a stride figure was set on.
Matching stride to track
Stride type maps onto track shape as neatly as it maps onto trip. A long-striding horse wants room to wind up and hold that stride, which means a wide, galloping circuit, the kind of flat galloping track with long straights and sweeping turns. A short, nimble, quick-cadence horse is better suited to a tight, turning track, where it can shift its feet through the bends rather than stretch out, with Chester the textbook example of a circuit that suits the smaller, sharper sort.
This feeds the same judgement you would reach from draw bias and pace, from a different direction. If a long-striding galloper has been beaten round a turning track, the stride profile gives you a concrete reason to forgive the run and wait for a galloping circuit, rather than marking it down on the bare result.
Formdial’s free Pace Analyser does the mechanical half of this: it scores a field’s recent run styles and maps the likely shape.
Where to find it, and what it costs
The good news is that the best of it is now free. At The Races has carried stride data since 2018, on a free Stride Data tab on its result pages, drawing on the Total Performance Data saddlecloth feed from the ARC tracks. Racing TV went further in March 2025, opening its RaceiQ metrics to everyone with no login required, covering every British and Irish race within minutes of the off. Both surface the same core figures: average stride length and cadence, for the whole race and per furlong, plus the maximum and minimum of each.
Behind the scenes, Britain’s tracking was consolidated into a single database in 2024, fed by two suppliers, Coursetrack for the Racecourse Media Group courses and Total Performance Data for the ARC and independent tracks, covering all 59 GB racecourses between them. For anyone wanting to build their own model, Timeform still sells deeper sectional and stride spreadsheets by subscription, with its analytical columns layered on top. The raw material that used to be a specialist’s toy is now a mainstream tool, free at the point of use on a racecard read after the off.
The honest limits
Stride data is a sharp guide, not gospel, and it pays to know exactly where it bends.
Read it with these in mind
- GPS carries a small margin — around a metre, not far off half a length — so do not read the figures to false precision.
- One run is a tiny sample. A profile firms up over several starts; a single peak figure is the least trustworthy version of it.
- Stride length is distorted by going, gradient and bends, so raw cross-track comparisons are not like for like.
- Two supplier pipelines feed Britain’s data at different sampling rates, so figures are not perfectly comparable between providers.
- It is probabilistic, not deterministic. Some horses defy their profile — Camelot won the 2012 Guineas on a middle-distance cadence — and on whether cadence shifts as a horse matures the published position itself moved — Rowlands listed it as unclear in 2018, then by 2019 held that it essentially does not change — so treat it as unsettled.
- Never use it in isolation. It is one input, weighed against sectionals, speed figures, pace, class and pedigree.
How stride data fits with the rest
None of this is a crystal ball, and none of it works alone. Pace, speed figures and sectionals correct the lies the placings tell about how a race was run. Stride data answers a different question, the one the form book is worst at: what does this horse actually want? Read the engine alongside the race, and the four layers point at the same conclusion from four directions. That agreement, when it comes, is where the market is slowest to catch up.
Common Questions
It is the breakdown of a horse’s speed into its two components: stride length, the ground covered per stride, and stride frequency or cadence, the number of strides per second. Speed is simply length multiplied by frequency, so stride data describes how a horse physically produces its pace.
A GPS sensor in the saddlecloth fixes each runner’s position many times a second. Stride length and cadence are derived from the oscillations in that position trace, not from a separate sensor, and the readings are averaged per furlong. The GPS carries a margin of about a metre.
Broadly yes, as stride length tracks class — elite horses such as Frankel (about 27.3 feet, a single-race peak at Goodwood in 2011) top 27 feet. But stride length stretches on fast ground and shortens on soft, so it is an ability clue rather than a fixed measure, and cannot be compared across tracks like for like.
As a rough guide, sprinters peak above about 2.50 strides a second (a threshold that moved from 2.43 as the data grew), milers around 2.40 to 2.45, middle-distance types about 2.20 to 2.35, and stayers below 2.20. A peak under roughly 2.40 points to beyond a mile, and 2.35 or less to a mile and a half or beyond. These are guides, not hard lines.
At The Races has shown it free on its result pages since 2018, and Racing TV opened its RaceiQ metrics to everyone with no login in March 2025, covering every British and Irish race minutes after the off. Timeform sells deeper sectional and stride spreadsheets by subscription.
No. It is one input, not a standalone signal. It is probabilistic and has exceptions — Camelot won the 2012 Guineas on a middle-distance cadence — so weigh it alongside sectional times, speed figures, pace, class and pedigree rather than betting off a single number.